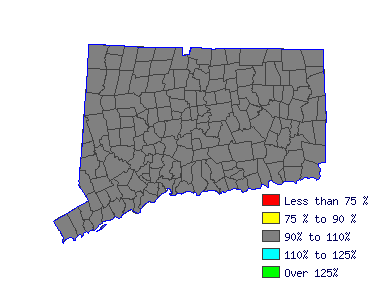
| Northwest WDA (1Q 2016) |
| All Industry |
| Estimated employment | 350 |
| Mean wage | $23.84 |
| Entry wage | $16.84 |
| 10th percentile wage | $16.12 |
| 50th percentile wage | $23.03 |
| 90th percentile wage | $34.65 |
 |
| Top Employing Industries |
| Industry | Employment / Percent |
| Professional and Business Services | 120 | 36.2% |
| Education and Health Services | 110 | 32.2% |
| Public Administration | 20 | 7.2% |
| Construction | 20 | 6.5% |
| Manufacturing | 20 | 6.3% |
 |
| Top Paying Industries |
| Industry | Employment / Median Wage |
| Trade, Transportation and Utilities | 20 | $25.38 |
| Professional and Business Services | 120 | $24.17 |
| Public Administration | 20 | $24.17 |
| Construction | 20 | $22.64 |
| Education and Health Services | 110 | $22.24 |
 |


